Introduction
both a particle (photon) and a wave (energy).

- Shorter wavelengths have more waves pass by in the same amount of time
(higher frequency).
- Longer wavelengths have fewer waves pass by in the same amount of time
(lower frequency).

The full electromagnetic spectrum stretches from gamma rays (so small they can pass through atoms) - to radio waves (as long as buildings)! The colours we see occupy less than one trillionth of that entire range. Everything outside this window is invisible to the naked eye.
- Reflection: Photons can bounce off materials. This reflected light is what gives objects their visible colour.
- Absorption: Photons can be captured by materials. Darker surfaces absorb more light, converting it into heat.
- Refraction: When photons pass through materials like water or glass, they slow down and bend.

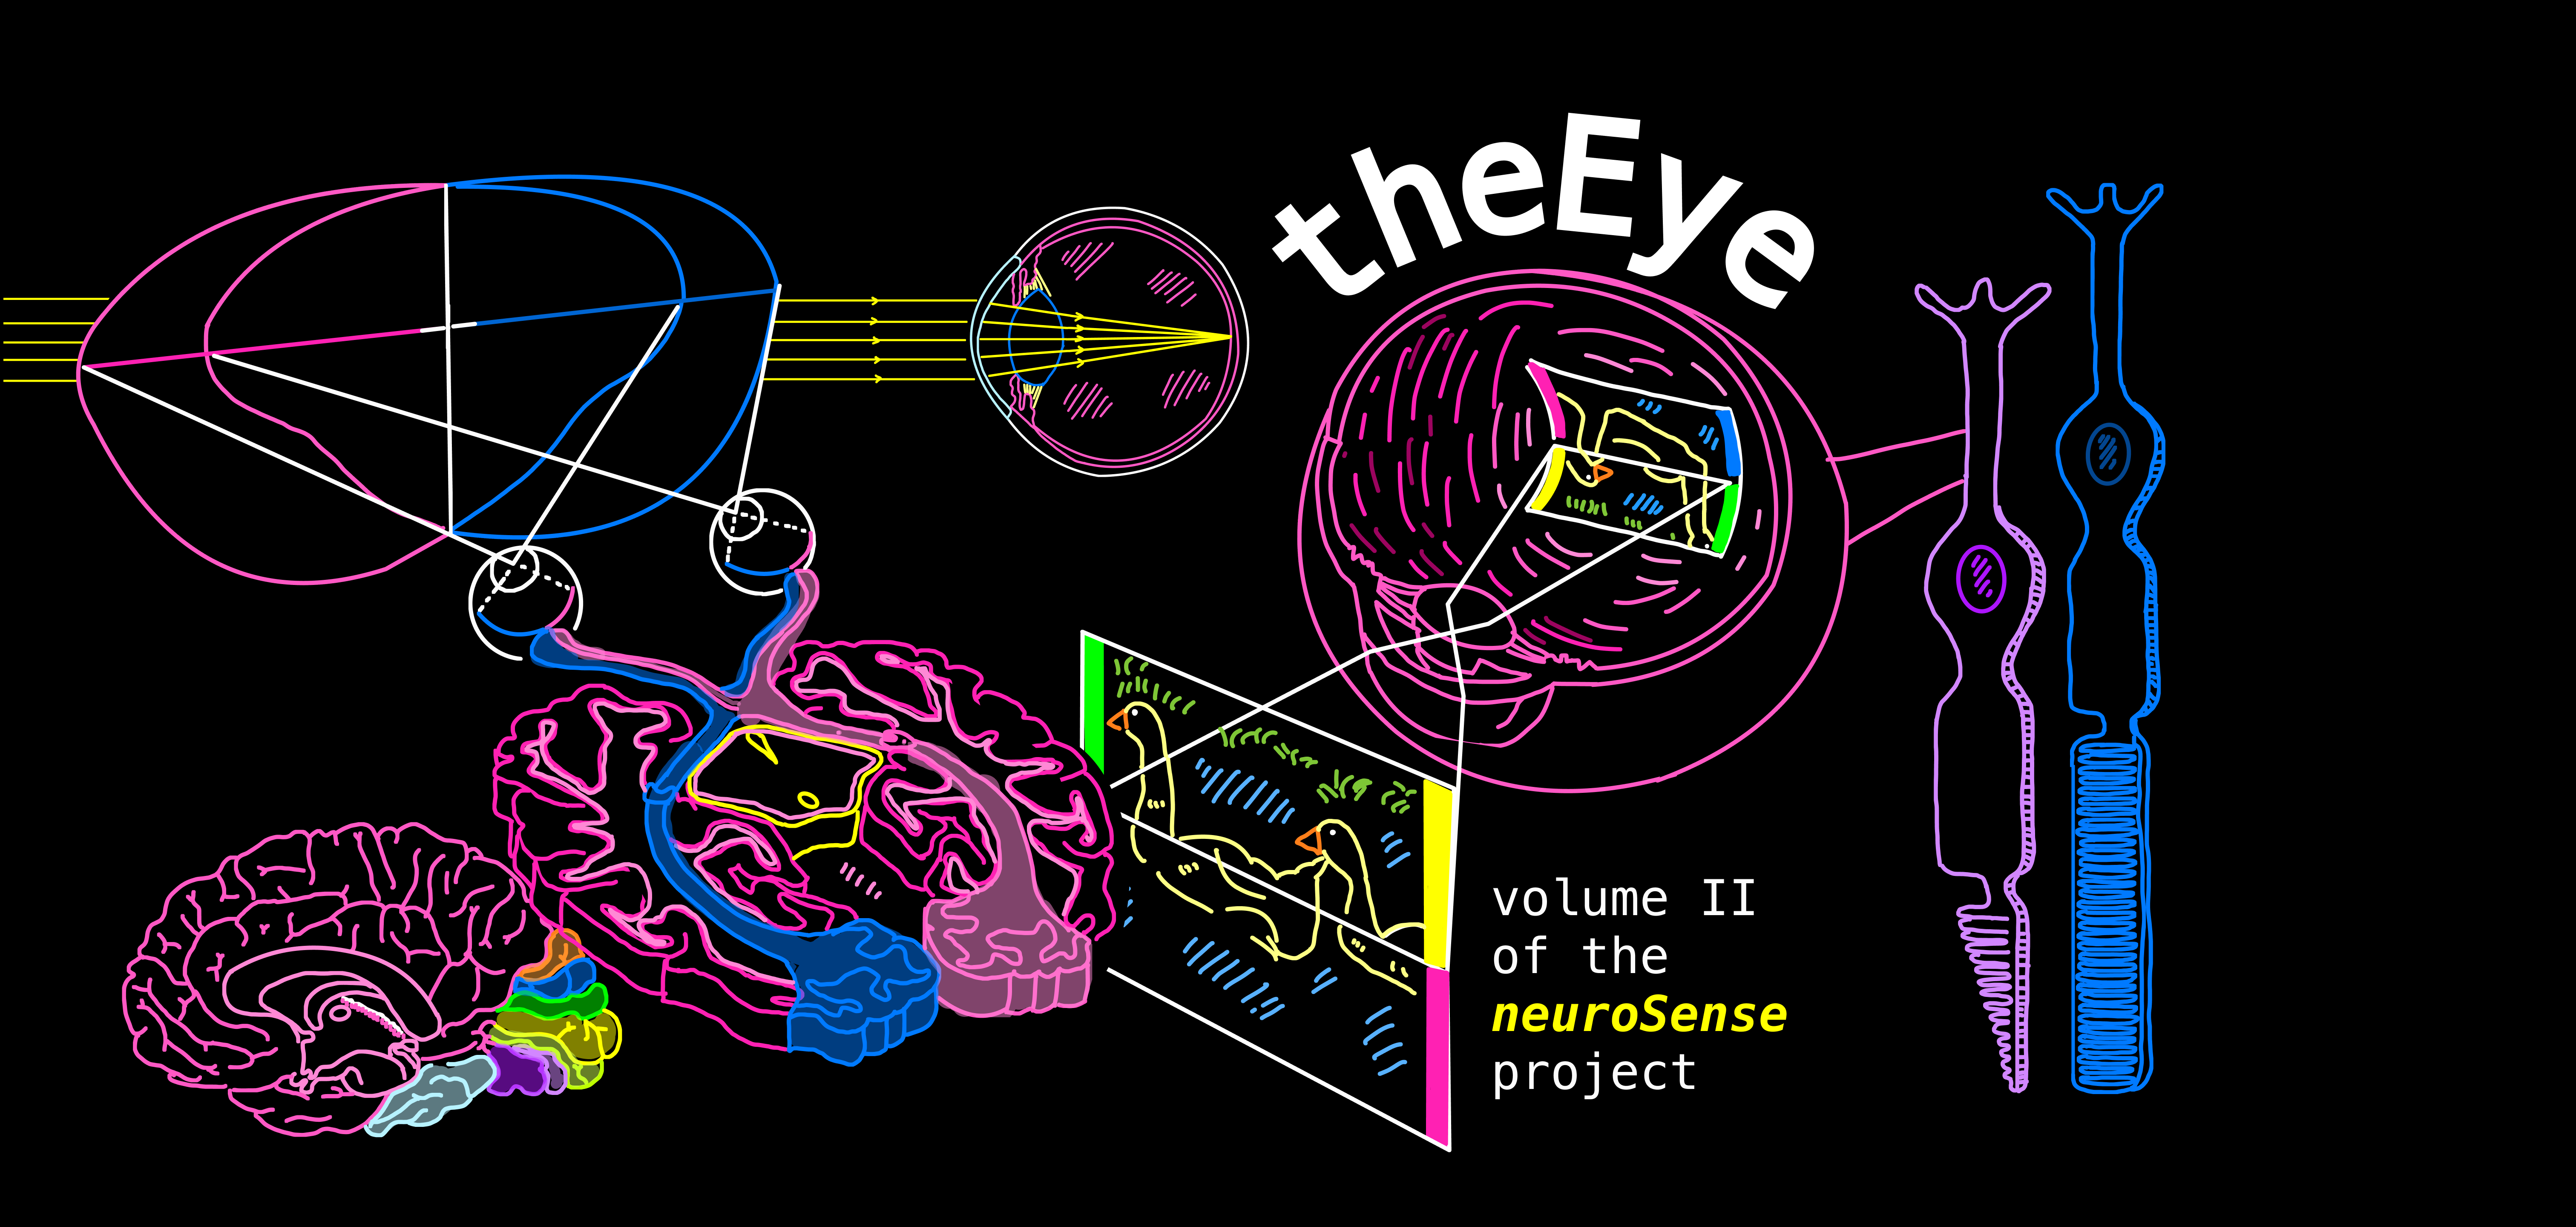
This volume follows the journey of light as it enters the eye, strikes the retina, and transforms into electrical signals the brain can interpret.
From the lens, the photoreceptors that detect light, through the neural circuits that extract key features — we’ll explore how the eye captures information and why vision serves as such a powerful filter of the world around us.
Structure & Anatomy
Its parts work together to capture and focus light, filtering the physical world.

- Pupil: The dark circular opening at the center of the eye. It’s not a structure itself, but a hole that allows light to enter.
- Iris: The colour of the eye. Muscles near the iris control the size of the pupil. The pupil expands in low light to let more light in, and contracts in bright light to prevent overstimulation.
- Cornea: The transparent, dome-shaped outer layer that covers the front of the eye. It makes contact with the conjunctiva.
- Conjunctiva: The mucous membrane that covers the front of the eye and lines the inside of the eyelids.

- Sclera: Whites of the eyes (behind iris). A tough substance that gives the eye its shape.
- Extra-ocular muscles: A set of six muscles (four rectus and two oblique) that move the eyeball up, down, left, right, and allow for subtle rotational movements. We have conscious control over these muscles.
- Ciliary muscles: Distinct from extra-ocular muscles, ciliary muscles operate on a subconscious level. They change the shape of the lens slightly to help focus on things that are different distances apart.
- Aqueous Humour: A thin, watery layer of fluid that fills the space between the cornea and the iris. It provides nourishment and is the first medium to refract incoming light.
- Vitreous: Within the whites of the eye. It's more gelatinous than the aqueous humour and helps the eye keep its shape.
- Lens: A clear, flexible disk that sits directly behind the iris. It focuses light onto the retina by changing shape. The lens is connected to ciliary muscles by threads called zonule fibres.
- Retina: A thin, delicate layer of neural tissue that lines the inside of the eye — particularly the back half — and contains the cells responsible for detecting light.
- Fovea (latin for pit): A specialised region of the retina responsible for our sharpest, most detailed vision.
- Optic disc: The region of the retina where blood vessels enter the eye and the optic nerve fibres exit.
- Optic nerve: The bundle of axons from retinal ganglion cells that carries visual information from the back of the eye (the retina) to the brain. It serves as the main communication pathway between the eye and the central visual system.
The Blind Spot
All ganglion cell axons converge here, and together they form the optic nerve, the main pathway carrying visual information to the brain.
This region is crowded with outgoing axons and incoming blood vessels. Blood is essential for our bodies, but to neurons, it’s poison! Direct contact can be very toxic, so vessels stay carefully separated from the cells they nourish.
Because the optic disc is packed with vessels and axons, there’s no room for photoreceptors — the neurons that actually process light — so it cannot detect light at all.
This creates a small gap in our visual field: the blind spot.

The retina has another specialised region called the macula, an area with far fewer blood vessels. At its center is the fovea, the point of highest visual acuity.
Here, the eye clears away anything that could get between incoming photons and photoreceptors - so light can strike the cells with maximum precision.
All of this means that the visual world we think we perceive is only a fraction of what actually exists. Our brains fill in gaps and reconstruct patterns from incomplete information.
Combined with our limited access to the electromagnetic spectrum, it becomes obvious: the world we experience is built as much from the brain’s assumptions as it is from actual light. An elegant illusion, isn't it?
How the Lens Works
The angle of refraction depends on where the light hits the cornea and the curvature at that point.
The lens fine-tunes this light, adjusting it to focus on a single point on the retina, specifically the fovea, where visual acuity is highest.
The cornea does most of the eye’s bending (about 40 D). The lens adds fine-tuning (about 20 D at rest) and can increase slightly during accommodation for near vision.
The human eye has a preferred focal distance of about 9 meters.

- The lens is flat and long.
- Ciliary muscles are relaxed.

- The ciliary muscles contract, changing the tension on the zonule fibres.
- Zonule fibres loosen slightly, allowing the lens to become rounder and fatter.
- This shape change bends incoming light more sharply, keeping the focal point exactly on the fovea.
- Far-sightedness (hyperopia): If the ciliary muscles are weak, they can’t properly adjust the lens for near objects. Light focuses behind the retina, making close objects blurry.
- Near-sightedness (myopia): Often caused by degeneration of the lens or an elongated eyeball, which makes light focus in front of the retina, blurring distant objects.
Inverse Topological Information
However, there’s a small twist: the image
projected onto the retina is inverted.
Upside-down: The top of the visual field hits the bottom of the retina, and the bottom hits the top.
Left-right flipped: The right side of the visual field hits the left side of the retina, and vice versa.
Let’s use these ducks as an example!
The yellow stripe in the upper-right corner of the picture ends up on the lower-left portion of the retina.
The brain’s job is to reinterpret this map so that the world appears upright and correctly oriented.

Microscopic Structure
.svg)
- Photoreceptors [photo meaning light]: These are the first and only cells that are sensitive/responsive to light. They are divided into rods and cones.
- Bipolar cells: Neurons that have two extensions
(1 axon, 1 dendrite).
- Ganglion cells: The only cells that project out of the retina (the only cells here that fire action potentials).
Everything else in this structure is communicated in a graded fashion (neurotransmitter release) instead of our classic binary action potentials.
Pathway
Light enters the eye → strikes photoreceptor cells → is transduced into a chemical signal → transmitted to bipolar cells → relayed to ganglion cells → axons converge to form the optic nerve → information is carried to the visual cortex.
Photoreceptor → Bipolar cell → Ganglion cell.
You'll notice there are two intermediary players in the retina that help modulate these signals.
- Horizontal cells: Which connect photoreceptors to bipolar cells.
- Amacrine cells: Which connect bipolar cells to ganglion cells.
Visual Acuity
1-1-1 connection: In the central retina,
1 photoreceptor cell talks to 1 bipolar cell and 1 ganglion cell.
This direct, private communication channel preserves every tiny detail of the visual scene. No information gets mixed or averaged out.
As we move away from the fovea into the peripheral retina, multiple photoreceptors converge onto fewer bipolar cells, which in turn converge onto a single ganglion cell.
This summation of signals reduces spatial precision, making peripheral vision less sensitive to fine detail.

Laminar Organisation of the Retina
Light enters the eye and must first pass through layers of ganglion and bipolar cells before reaching the photoreceptors at the very back of the retina.

Once light reaches the photoreceptors, they transduce it into chemical signals and communicate back through the retinal layers. Ganglion cell axons then exit the eye via the optic nerve, carrying the visual information to the brain.
And yes — I know this might feel like a lot of repetition. But trust me, repetition is key to learning <3
Photoreceptor communication is graded: they release more or less neurotransmitter depending on the intensity of light, rather than firing classic all-or-none action potentials.
- The pigmented epithelium are dark layers of cells that act like a back stop. They absorb all the photons that don’t get picked up by the photoreceptors so they don’t continue to bounce around the eye.
Photoreceptor Cells
The main difference between them is sensitivity.
- Rods are roughly 1000 times more sensitive to light than cones, allowing them to detect very low levels of illumination.
- Cones are less sensitive to light but provide colour vision and high spatial resolution.

Cones are concentrated in the fovea, excellent for colour and detail.

Both rods and cones contain opsin proteins, each with a retinal molecule. Opsins are embedded in membrane disks, which increases the surface area for photon capture. When a photon hits the retinal molecule, it changes its configuration, triggering phototransduction.
Fovea Specialisation
The fovea itself is a physical pit in the retina. At its very center, the usual “backwards” retinal organisation doesn’t apply: the overlying bipolar and ganglion cell layers sweep aside, creating a clear path for incoming light to hit the photoreceptors directly.
This absence of scattering contributes to the fovea’s extraordinary sensitivity and resolution.
Across the whole retina, rods vastly outnumber cones:
- ~92 million rods
- ~5 million cones

Because the periphery contains so few cones, our colour perception outside the center of our gaze is actually much weaker than we intuitively feel.
The brain helps fill in these gaps to create the illusion of a fully colourful world, even though the raw data in the periphery is mostly grayscale and motion-heavy.
Phototransduction
- Light hyperpolarises photoreceptors.
- The dark depolarises photoreceptors.
Rod Mechanisms
- Dark
When the rod is in darkness - its "resting" state - the sodium channels in the membrane are open. Sodium ions (Na+) flow into the cell, following both their electrical and chemical gradients. This constant inward current keeps the rod depolarised in the dark.
- Light
When a photon hits an opsin molecule, it triggers a biochemical cascade that ultimately closes the sodium channels. With Na⁺ no longer able to enter, the inside of the cell becomes less positive. So, rods become hyperpolarised in the light, with far less neurotransmitter released compared to the dark.

Cone Mechanisms
This is the foundation of our colour vision! We have three classes of cones, each containing a slightly different opsin protein.
These opsins are structurally tweaked just enough to make each cone type most sensitive to a particular band of wavelengths.
- S-cones: These are most sensitive to short wavelengths (blues)
- M-cones: These are most sensitive to medium wavelengths (greens)
- L-cones: These are most sensitive to long wavelengths (reds)

Each cone type responds to a range of wavelengths rather than one perfect peak. Because their sensitivity curves overlap, the brain can interpret a wide spectrum of colours by analysing the combined activity patterns across S-, M-, and L- cones.
Colourblindness
- Dichromacy: Here, one cone type is completely non-functional. Given only two working cone types, an entire axis of colour discrimination is lost.
- Anomalous trichromacy: The cone is present but doesn’t function normally. For example, the green (M) cone might respond to a different range of wavelengths or respond weakly. Colours are still detectable, but they look less vibrant or shift in hue.

This green colourblindness anomaly is sex-linked.
The genes that code for red (L) and green (M) opsins sit on the X chromosome. Because biological males have only one X chromosome (XY), a mutation on that single X has nothing to “balance” it out — so the colour vision deficit shows up.
Biological females have two X chromosomes (XX), so if one has a faulty opsin gene, the other X often provides a working copy. This makes the condition much less common in biological females.
- Roughly 6% of biological males are colourblind.
In contrast, only about 0.4% of biological females are.
- Hyper-colour perception (Tetrachromacy): Some people — typically biological females — have a fourth cone type, usually due to slight opsin gene variations across their two X chromosomes. This can give them enhanced colour discrimination, especially in ranges where two cone sensitivities overlap.
It’s not quite “seeing new colours” but seeing more subtle distinctions between shades.
Receptive Field

The most famous receptive fields in the retina belong to ganglion cells and they come in two major types.
- On-Center
These ganglion cells prefer light in the center of their receptive field.
Light on the center → increases firing.
Light on the surround → decreases firing.
- Off-Center
These ganglion cells respond in the opposite way.
Light on the center → decreases firing.
Light on the surround → increases firing.
On-center and off-center receptive fields show opposite responses to light, and this difference comes from the two types of bipolar cells that feed into the ganglion cells.
Note: The information I'm about to explain is pretty confusing, and it took me some time to wrap my head around it (was definitely what I revisited most when studying for finals). If it doesn't click right away, that's okay! This is exactly why we revisit concepts more than once. Repetition is key to building a strong understanding. Oh, did I say that already? I must've repeat myself hehe...
On-Center
- The first cell in the chain is our photoreceptor. Remember, photoreceptors behave backwards compared to typical neurons - they are depolarised in the dark and hyperpolarised in the light.
Thus, the cone will hyperpolarise even further.
The neurotransmitter that these cells release is glutamate. If this cone is hyperpolarising, it is going to release less glutamate.
- At this stage, we have two bipolar cells connected to the same photoreceptor:
(a) On-center bipolar cell
(b) Off-center bipolar cell
These two cells respond differently to glutamate depending on the type of glutamate receptors they have
On-center bipolar cells have metabotropic glutamate receptors. When glutamate binds to them, the cell hyperpolarises. This means:
More glutamate → more inhibition
Less glutamate → more excitation

In the dark, the opposite happens: the cone releases more glutamate, the on-center bipolar cell hyperpolarises, and the ganglion cell fires less.
Okay, you still with me...?
Remember the photoreceptor is simultaneously making a synapse on the off-center bipolar cell. These have ionotropic glutamate receptors, so they respond to glutamate in the opposite way.
More glutamate → depolarisation
Less glutamate → hyperpolarisation
This means that when light hits the photoreceptor, the off-center bipolar cell hyperpolarises and sends less neurotransmitter to its ganglion cell. In the dark, it depolarises, releasing more neurotransmitter and increasing ganglion cell firing.
The more glutamate that is released onto the corresponding off-center ganglion cell from its bipolar cell, the more action potentials it will fire in response.
The key is that ON- and OFF- center bipolar cells have opposite responses to the same glutamate signal, allowing the retina to differentiate between light and dark regions.
- Each bipolar cell connects to a ganglion cell, which mirrors its activity.
Depolarised bipolar cell → depolarised ganglion cell → more action potentials.
Hyperpolarised bipolar cell → hyperpolarised ganglion cell → fewer action potentials.
When photoreceptors hyperpolarise in response to light, they release less glutamate.
On-center bipolar cells: Depolarise when glutamate decreases → send more signals to their ganglion cells → increase firing.
Off-center bipolar cells: Hyperpolarise when glutamate decreases → send fewer signals to their ganglion cells → decrease firing.
The same light signal can create opposite responses depending on whether the cell is ON- or OFF- center — a key part of how our retina detects contrast and edges in the visual scene.
Remember, there are two intermediate players in the retina that help modulate these signals: horizontal and amacrine cells,
- If the the surround is dark...
The photoreceptors in the surround will depolarise, causing them to release more glutamate onto the horizontal cell that it’s connected to. This horizontal cell will depolarise in response to the glutamate and release its own inhibitory neurotransmitter GABA. GABA will further inhibit the center photoreceptor, causing it to release even less glutamate.
This situation will create the highest response in the on-center ganglion cell since it prefers conditions of lower glutamate due to its metabotropic receptors.
- If the surround is light...
Surround photoreceptors hyperpolarise and release less glutamate onto horizontal cells. These horizontal cells hyperpolarise and release less GABA, meaning the center photoreceptors are less inhibited and release more glutamate. This dampens the response of the on-center bipolar cell and ganglion cell.
Ok, NOW we're done with this pathway...onto the next.
Off-Center
- The cone corresponding to the center of this field is in the dark, so it depolarises and releases more glutamate onto its partner bipolar cells.
- On-center bipolar cell: More glutamate inhibits the on-center bipolar cell, reducing its neurotransmitter release to the ganglion cell → fewer action potentials.
Off-center bipolar cell: More glutamate excites the off-center bipolar cell, causing it to release more neurotransmitter → more action potentials.
- The same photoreceptor signal produces opposite responses in its two partner bipolar cells.
The on-center bipolar cell is inhibited, sending fewer signals to its ganglion cell, while the off-center bipolar cell is excited, sending more signals to its ganglion cell.
With this system, our visual system is tuned to contrast rather than absolute brightness: we can tell when the center of a receptive field is brighter than the surroundings, darker than the surroundings, or anywhere in between.

Make sense? I learn best through examples, so let's do a few together!
- On-center cell
(1) We shine light directly on the center of the visual field that the on-center ganglion cell is “watching” → the on-center bipolar cell depolarises → the ganglion cell fires lots of action potentials!
(2) We shine light on the surround (off-center) of the visual field → the on-center bipolar cell is inhibited → the ganglion cell fires fewer action potentials.

- Off-center cell
(1) We shine light onto the center of the visual field → the off-center bipolar cell hyperpolarises → the ganglion cell fires fewer action potentials.
(2) We shine light onto the surround of the visual field → the off-center bipolar cell depolarises → the ganglion cell fires more action potentials.
Here, you stare at a bright, contrasting image for around a minute. When the light stimulus is suddenly removed, the photoreceptors and bipolar cells don't immediately stop responding, they briefly "bounce back" as they return to their baseline activity.
This rebound creates the perception of the opposite colour. For instance, staring at yellow activates your yellow-sensitive cones strongly. When you look away, you might briefly perceive blue as your system readjusts.
Click here to try the experiment yourself!
ON- OFF- Center Ganglion Cell

- Visual world is completely dark (both center and surround are dark) → the ganglion cell fires at its baseline level.
- Light in the surround only (center is dark but the surround is lit) → the on-center bipolar cell hyperpolarises → the ganglion cell fires less than baseline.
- Some light in the center, some in the surround → the opposing effects roughly cancel out → the ganglion cell fires at baseline.
- Whole center lit, surround darker → the strongest difference between center and surround → the ganglion cell fires the most action potentials.
- Entire receptive field lit (center and surround equally bright) → the contrast is low → the ganglion cell fires less than the peak because it cares more about contrast differences than absolute brightness.
Light in the center → fewer action potentials. Light in the surround → more action potentials. Partial illumination (center vs. surround) → intermediate firing based on contrast.
Would you believe we’re only halfway through theEye? This volume's a long one!
Click the button below to continue to Part II, where we’ll dive into the central visual system - exploring brain pathways, circuits, and key features of the visual cortex that make sight possible.
Summary
- Light is electromagnetic radiation, both a particle and a wave; only a small band is visible to humans.
Light can be reflected, absorbed, or refracted; these properties affect how we see objects.
White objects reflect all visible light; dark objects absorb more light. Materials like water bend light.
- Cornea & Lens: Focus light onto the retina. Lens shape adjusted by ciliary muscles.
Pupil & Iris: Regulate light entering the eye.
Retina: Contains photoreceptors (rods & cones) that detect light and colour.
Fovea: Center of vision, highest acuity (mostly cones).
Optic Nerve & Disc: Transmit visual signals to the brain; creates the blind spot.
Vitreous & Aqueous Humour: Maintain eye shape and refract light.
- Images are flipped on the retina (upside-down, left-right reversed). The brain reconstructs the correct orientation of the visual scene.
- Photoreceptors → Bipolar cells → Ganglion cells carry visual signals.
Horizontal & Amacrine cells modulate signal processing.
Fovea has 1:1:1 connections for highest visual detail; periphery pools signals, reducing sharpness.
- Light hyperpolarises photoreceptors (opposite of typical neurons).
The dark depolarises photoreceptors.
- Rods: High sensitivity to light, mostly peripheral, monochrome vision.
Cones: Lower sensitivity to light, mostly in the fovea, colour vision.
(S-cone = blue, M-cone = green, L-cone = red)
Opsins: Proteins in photoreceptors that detect photons and trigger phototransduction.
- Colour perception arises from the combination of cone responses.
Colourblindness: Missing or defective cones; red–green most common, often sex-linked (biological males more likely to have)
Some individuals have enhanced colour perception via a fourth cone.
- Each ganglion cell responds to a specific retinal region.
ON- / OFF- center fields detect contrast between center and surround.
This allows sensitivity to edges, contrast, and patterns rather than absolute brightness. Explains visual illusions like afterimages.
Key Terms
Below are definitions of common terms used throughout the volume.
Neurons
Neurons are the basic cells of the nervous system.
They send and receive information through electrical and chemical signals.
- Cell body (soma): The “hub” of the neuron. It contains the nucleus and all the usual cell machinery needed to stay alive.
- Neurite: A collective term to denote both axons and dendrites.
- Axons allow a neuron to pass information to other neurons.
Dendrites allow a neuron to receive information from other neurons.


Action Potential
A rapid electrical “spike” that neurons use to send information. It’s an all-or-nothing event: once the signal starts, it travels down the axon until it reaches the end of the cell, where it triggers the release of neurotransmitters.
An all or nothing approach is like flushing a toilet! You can either flush (have an action potential), or not flush (not have an action potential).
It doesn’t matter how hard/long you push the handle, same functionality applies.
These are the brain’s chemical messengers. They carry signals between neurons across the synapse (the tiny gap between cells).
When an action potential reaches the end of an axon, it triggers the release of neurotransmitters. These molecules cross the synapse and bind to receptors on the next neuron, influencing whether that cell will fire its own signal.
Different neurotransmitters have different effects: some excite (make a neuron more likely to fire), others inhibit (make it less likely).
GABA (gamma-aminobutyric acid) is the main inhibitory neurotransmitter. It calms neural activity and prevents circuits from becoming over-excited (too much unchecked exicatory activity can actually damage our neurons).
Together, glutamate and GABA create a precise balance that allows the visual system, and the entire brain, to remain stable, responsive, and incredibly efficient.
Neurons rely on gradients to generate signals. A gradient simply means there is more of something on one side of the cell membrane than the other.
Chemical gradient: There are different concentrations of ions (like sodium and potassium) inside vs. outside the neuron. Ions naturally want to move from areas of high concentration to low concentration due to entropy. This is called diffusion.

The neuron's interior is typically negatively charged relative to the outside. Positively charged ions are attracted to negative areas and repelled by positive ones (and vice versa), creating an electrical force that can either reinforce or oppose the chemical gradient.

When the chemical and electrical gradients work in the same direction, ions flow easily through open channels.
When they oppose each other, the ion may reach equilibrium (where the two forces balance out) or require energy to move against the combined gradient. This stored electrochemical energy is what neurons use to generate and propagate signals.
In photoreceptors, these gradients determine whether ion channels open or close, which controls whether the cell is depolarised or hyperpolarised when light hits the retina.
Remember, neurons maintain a difference in charge between the inside and outside of the cell. The inside is usually more negative than the outside (this is called the resting membrane potential).
- Depolarisation: The inside becomes less negative (more positive) moving closer to the threshold needed to fire an action potential. This increases the likelihood that an action potential will occur.
- Hyperpolarisation: The inside becomes even more negative, moving further from the threshold. This reduces the chance that an action potential will occur.
Neurons respond to neurotransmitters using different kinds of receptors.
Metabotropic receptors: These are slower, indirect receptors. Instead of opening a channel right away, they trigger a biochemical cascade inside the cell that eventually alters ion channels or cell behaviour. Think of metabotropic receptors as dimmer switches — slower, but capable of fine control.
Together, these two systems let the visual system be both fast and highly adaptable.
Directional Terms
When describing the brain, we use special anatomical directions to keep things consistent.
e.g., the frontal lobe is anterior to the visual cortex.
Posterior: Toward the back.
e.g., the cerebellum is posterior to the visual cortex.
Dorsal: Toward the top.
e.g., In the brain, toward the top of the head.
Ventral: Toward the bottom.
e.g., In the brain, toward the base of the skull.


Medial: Toward the midline.
e.g., middle of the body/brain.
Lateral: Toward the sides.
e.g., your ears are lateral to your eyes.
Rostral: Toward the nose
(or front of the brain).
Caudal: Toward the tail
(or back of the brain).
Ipsilateral: Same side.
Contralateral: Opposite side.
e.g., The visual cortex is superior to the brainstem.
Inferior: Below.
e.g., the brainstem is inferior to the visual cortex.